
What $95 Oil Means for Inflation and Your Retirement Budget

🔵 Oil prices are climbing again. Gasoline is up nearly 30% from a year ago. With the May CPI report arriving on June 10 — six days before the Fed meets — here is what the energy picture means for purchasing power, interest rates, and the income side of a portfolio.
Key Points
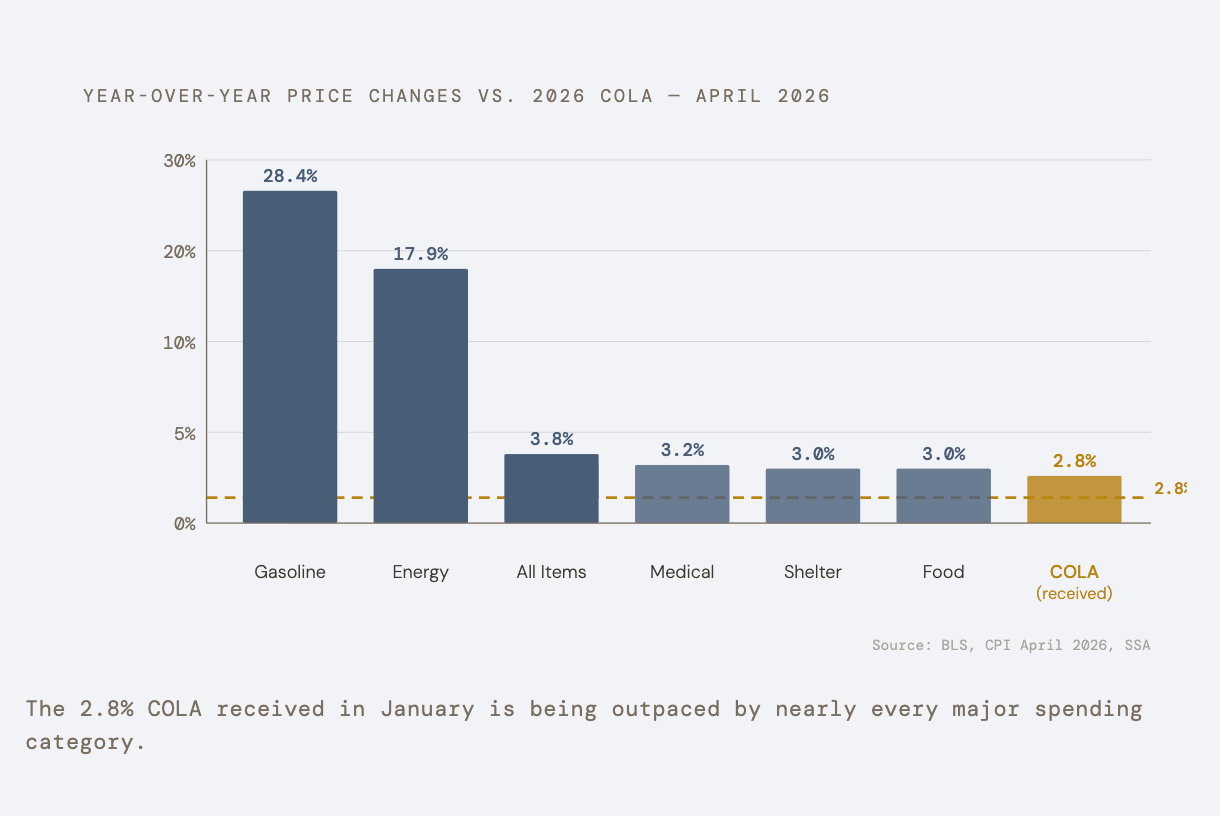
- Oil prices have climbed above $95 per barrel as Middle East tensions disrupted peace negotiations, pushing gasoline costs up 28.4% year-over-year and feeding headline inflation that now runs at 3.8% — the highest since May 2023.
- The May CPI report arrives June 10, and it will be the last inflation reading before the Fed's June 16–17 meeting. Markets now price an 85% probability of a rate hike by year-end — up from 51% just last week — driven by rising energy costs and a labor market that refuses to slow.
- For retirees on fixed income, the 2.8% Social Security COLA received in January is already being outpaced by real-world inflation. The 2027 COLA forecast has jumped to 3.9%, but it will not arrive until January — leaving an eight-month gap where purchasing power erodes quietly.

Oil, Inflation, and the Data That Matters This Week
Last issue, this newsletter focused on the new Fed chair and what the rate outlook means for bonds and cash. This week, the story that matters most for your daily spending is coming from a different direction — the price of oil and how it feeds into every line item on your monthly budget.
Three things converged in the past few days. Oil climbed above $95 a barrel for a third consecutive session. The labor market came in stronger than expected. And the probability that the Fed raises rates by year-end jumped to 85% — a sharp move from the roughly 50% chance we discussed two days ago. Here is what each of those developments means, and how they connect to your purchasing power between now and January.
Oil Above $95: What Is Driving It
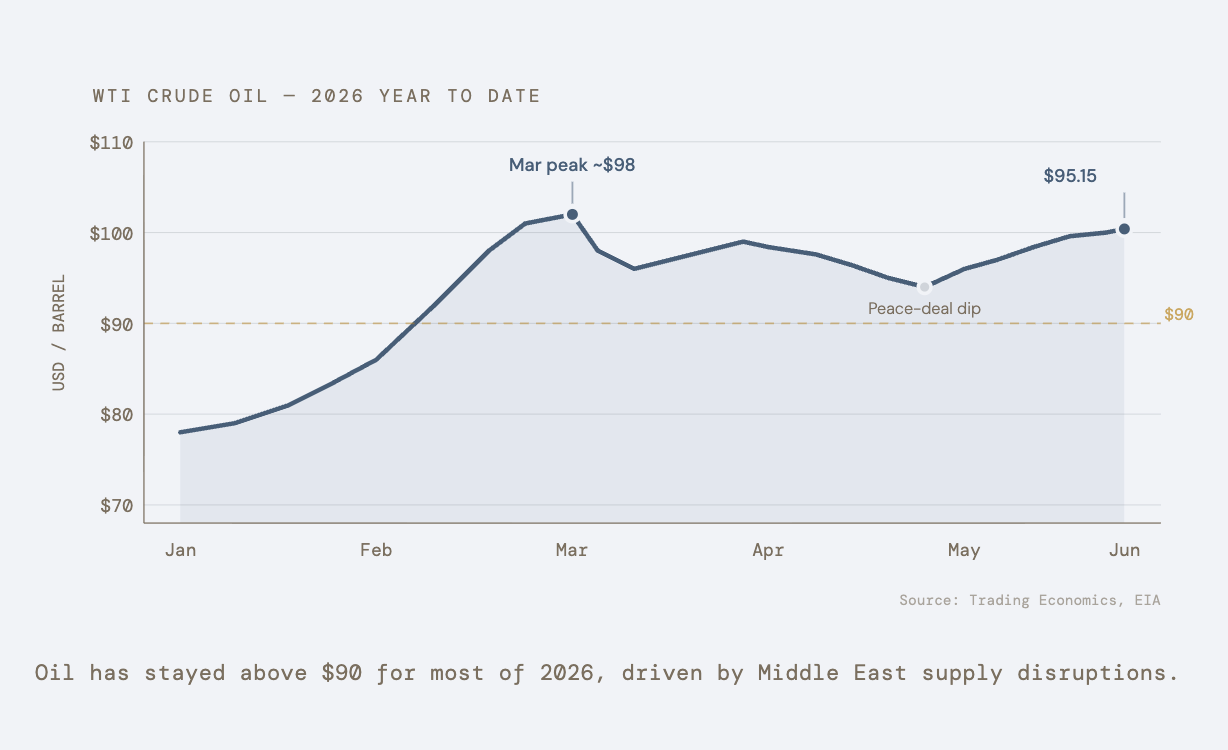
WTI crude closed above $95 per barrel on Wednesday — a third straight day of gains. Brent crude, the international benchmark, traded near $97. The immediate catalyst is familiar: Iran suspended its exchange of messages with the United States in response to Israel's expanding operations in Lebanon, and overnight clashes near the Strait of Hormuz — the narrow waterway that carries roughly one-fifth of the world's oil — intensified further.

U.S. crude inventories fell for a sixth consecutive week. The Energy Information Administration forecasts that global oil inventories will decline by an average of 8.5 million barrels per day through the end of the quarter. In plain terms, the world is drawing down its stored oil faster than producers are replacing it — and the primary bottleneck remains the Strait of Hormuz.
What makes this worth paying attention to right now is not the price of a barrel. It is the price of a gallon. Gasoline averaged $4.41 per gallon in April — up 28.4% from a year ago. For a retiree driving 10,000 miles a year in a car averaging 25 miles per gallon, that works out to roughly $1,764 per year on gasoline alone. A year ago, the same driving cost about $1,370. That is nearly $400 more, pulled directly from Social Security checks and portfolio withdrawals, with no raise to offset it until January.
Jobs Data and the Rate-Hike Path
Yesterday's ADP report showed that private employers added 122,000 jobs in May — above the 117,000 economists expected and a meaningful step up from April's revised 105,000. Earlier this week, the JOLTS report showed job openings at their highest level since November 2024. The labor market is not cooling. It is quietly accelerating.
This matters for interest rates. A strong labor market makes it harder for the Fed to justify holding rates steady, let alone cutting. Markets now price an 85% probability of a quarter-point rate hike by December 2026 — up from roughly 60% just a week ago. The ADP and JOLTS data both pointed in the same direction: employers are hiring, wages are holding, and the conditions that would give the Fed room to ease are not appearing.
For income-focused retirees, this has two sides. Bond fund prices remain under pressure — a rate hike would push them lower, with the impact depending on each fund's duration. On the other side, short-term Treasury yields and CD rates may rise further, rewarding patience in cash and short-duration positions. The 3-month Treasury bill currently yields 3.71%. The 1-year Treasury yields 3.80%.
Three dates in the next thirteen days will shape the rest of the quarter. Friday, June 5, brings the nonfarm payrolls report — the broadest measure of job creation. June 10 brings the CPI. June 16–17 is the FOMC meeting. In sequence, these three data points will determine whether rates stay, rise, or — less likely — begin to ease. The useful work right now is not prediction. It is preparation.
Why $95 Oil Hits Retirees Harder Than Most
Energy inflation does not hit everyone equally. Working-age households face higher gasoline and grocery prices, but they still have the next paycheck. Retirees on Social Security do not. Their January COLA was 2.8%, while headline inflation is running at 3.8%. That gap means purchasing power erodes every month until the next adjustment arrives in January 2027.
The pressure comes mainly from three energy-linked costs:
- Gasoline — the most visible and volatile hit.
- Heating and cooling — steady monthly bills for electricity and natural gas.
- Food — the hidden energy cost, because higher diesel prices raise the cost of moving groceries by truck.
The pattern is familiar. In 1973, after the OPEC oil embargo, crude prices quadrupled and energy costs spread through transportation, food, and manufacturing. Today’s shock is smaller, but the mechanism is the same: oil acts as an accelerant, pushing inflation into categories retirees cannot avoid. Higher rates can also pressure the fixed-income side of retirement portfolios.
The COLA math makes this especially important. The 2027 Social Security COLA will be based on CPI-W readings from July, August, and September 2026. If oil stays above $90, the adjustment could land near 3.9%, according to The Senior Citizens League. But that raise would still arrive late. The average retired worker receives $2,081 per month, and with inflation at 3.8%, that check loses about $6.50 per month, or roughly $79 per year, before COLA catches up.
What This Means For You
None of this requires a sudden move. The point this week is not to react to oil prices or inflation numbers — it is to measure. Know what you are spending, know what you are earning on cash and bonds, and know when the next data points arrive. That puts you ahead of the noise when it lands.
- Look at your monthly gasoline and utility spending from a year ago and compare it to the past three months. If the increase is larger than your Social Security COLA (2.8%), your purchasing power is being eroded in real time — and the next adjustment will not arrive until January 2027.
- Check the yield on any cash sitting in a standard bank savings account. The 3-month Treasury bill yields 3.71% and the 1-year Treasury yields 3.80%. If your bank pays less than 3%, that gap compounds every month and is worth quantifying in actual dollars lost.
- Mark June 10 (May CPI release) and June 16–17 (FOMC meeting) on your calendar. These two events, in sequence, will determine whether the rate environment shifts further. No action is needed before them — but knowing they are coming helps you distinguish signal from noise.
- If you hold bond funds, pull up the duration number on each one. With rate-hike probability now at 85% by year-end, a fund with a duration of 6 would lose roughly 6% of its value for each percentage point of rate increase. Knowing your exposure helps you decide whether to adjust — not whether to panic.
❓ Today’s Question
"If energy prices are the main driver of inflation right now, and the Social Security COLA lags behind by months, what practical steps can a retiree take to reduce their exposure to energy costs in the meantime — beyond just driving less?"
Short answer: Energy costs show up in three places on a retiree's budget: the gas pump, the utility bill, and — less visibly — the grocery receipt. Each one offers a different lever. On utilities, many states allow retirees to lock in a fixed-rate electricity or natural gas plan for six to twelve months, smoothing out the seasonal price swings that hit hardest in summer and winter. On groceries, the embedded transportation cost in food prices is hardest to avoid, but buying shelf-stable items when prices are lower and comparing per-unit costs across stores can offset some of the drift.
The structural point, though, is this: the COLA mechanism does eventually adjust. The CPI-W readings from July through September 2026 will determine the 2027 COLA, so if oil stays elevated this summer, the January raise will be larger. The gap is temporary — but it is real. A concrete step this week: pull your utility bills from the past three months, compare them to the same period last year, and see whether the dollar difference is larger than the 2.8% your Social Security check increased. That number tells you exactly how much purchasing power you are losing while the COLA catches up.

Oil prices have a way of making inflation feel personal. It is not an abstract number on a screen — it is the receipt at the pump, the electricity bill, the grocery total that keeps creeping higher. The honest answer is that nobody knows how long oil stays above $90, or whether the June CPI will surprise in either direction. What I do know, from watching several of these cycles, is that the mechanism is predictable even when the timing is not. Energy feeds into everything. The Fed responds. And the COLA catches up — eventually. The useful work right now is not prediction. It is measurement — knowing what you own, knowing what you spend, and having the patience to wait for the data before making moves. That is what steady looks like. 🔔
Regards,
David Ellison