What Changes When a New Fed Chair Takes the Podium for the First Time

🔵 Kevin Warsh chairs his first FOMC meeting in nine days — and the question is no longer whether rates will move. It's how the Fed will communicate from here on.Key Points
- The 10-year Treasury yield climbed to approximately 4.57% today as oil surged above $97 on renewed Iran–Israel hostilities — adding a new inflation wildcard days before the May CPI release on Wednesday.
- Kevin Warsh, the new Fed chair, is widely expected to hold rates steady on June 16–17, but he may eliminate or scale back the "dot plot" — the Fed's quarterly map of where rates are expected to go — which has shaped how bond markets and retirees have planned for the past decade.
- Early estimates now project a 2027 Social Security COLA of 3.9%–4.2% — higher than this year's 2.8% — but experts note that even that figure will likely fall short of what retirees actually experience in healthcare and housing costs.

Oil Above $97: Why the Iran Conflict Keeps Showing Up in Retirees' Budgets
Over the weekend, Iran and Israel exchanged fresh missile strikes. By Monday morning, Brent crude had jumped nearly 5% to $97.68 a barrel — its highest level in several weeks. The Strait of Hormuz, which carries roughly 35% of the world's seaborne oil trade, remains near-closed. OPEC+ approved a modest July production increase of 188,000 barrels per day, but that number does little to offset a supply disruption of this scale.
This matters to retirees in a way that is direct and measurable. Energy costs — gasoline, home heating, electricity — are a larger portion of a fixed-income budget than most financial summaries acknowledge. More importantly, energy-driven inflation feeds directly into the CPI numbers that shape Social Security income. Energy accounted for roughly 40% of April's inflation overshoot. Wednesday's May CPI reading, arriving at 8:30 a.m., will show whether that pressure held through May or began to ease. Some forecasters now project May CPI could approach 4.0%–4.2% year-over-year, given how persistent energy costs have been.
The conflict itself shows no near-term resolution. That is not alarm — it is context. Each ceasefire negotiation that stalls re-prices oil futures almost immediately, and Wednesday's number will reflect where energy prices were through most of May, not today.
The 10-Year at 4.57%: Where Bonds Stand the Day Before the CPI
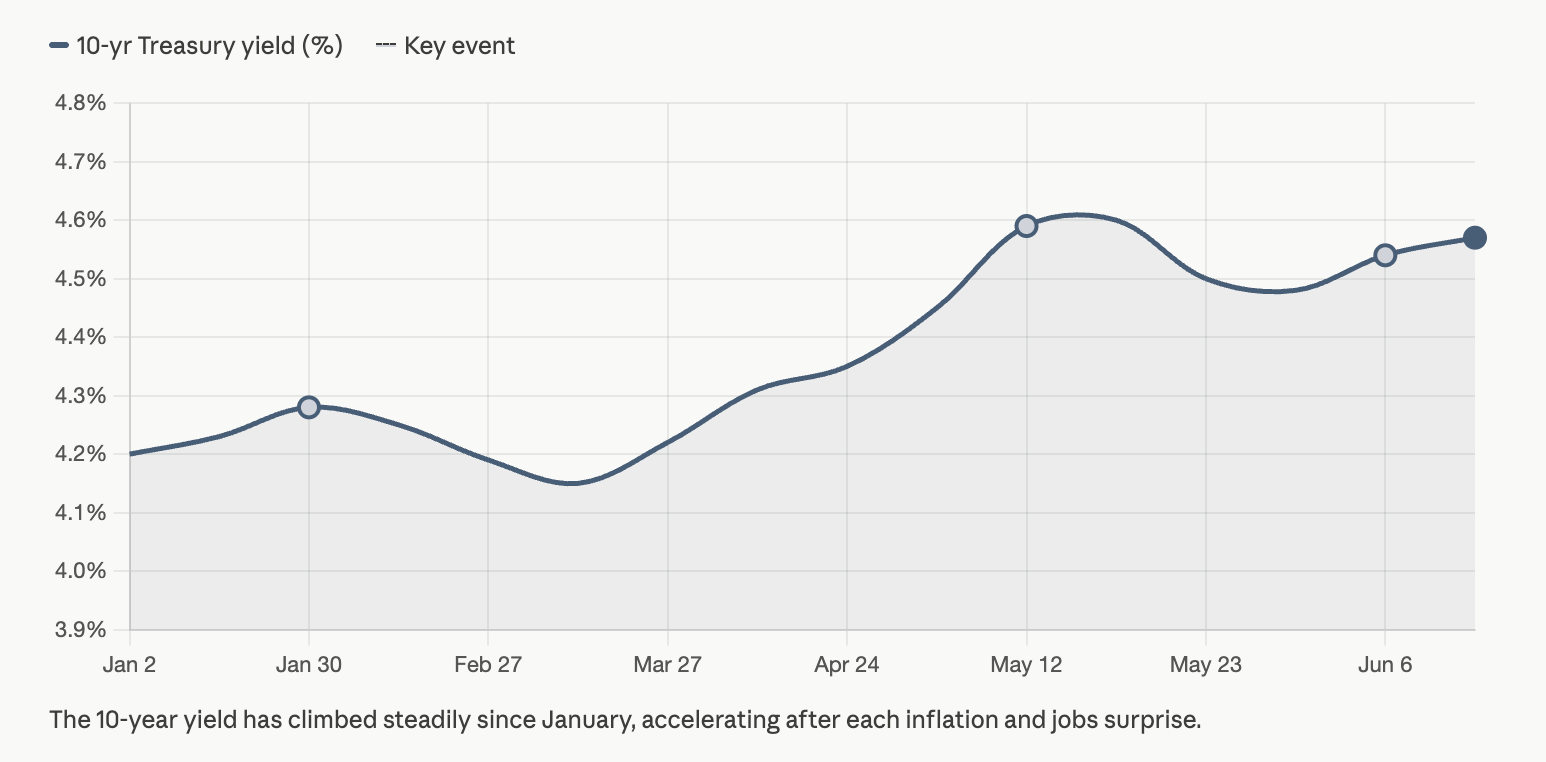
The 10-year Treasury yield — the government's benchmark borrowing rate, and the one that most directly influences bond fund prices and CD competition — climbed to approximately 4.57% today. That is its highest level in two weeks, pushed higher by Friday's jobs data and this morning's oil move. The 30-year sits near 5%. The 2-year is at approximately 4.16%.
What Warsh Changing Means for How Retirees Read the Fed
The June 16–17 FOMC meeting will almost certainly keep rates steady. Markets price a 97% chance of no change at 3.50%–3.75%. But the rate decision is not the real story. The bigger question is how Kevin Warsh changes the way the Fed communicates.
Warsh, sworn in on May 22, has long criticized forward guidance — the Fed’s habit of signaling future moves in advance. Under Powell, those signals helped income investors, bond managers, and retirees plan around expected cuts, holds, or hikes. They were the scaffolding.
The same question applies to the dot plot, the Fed’s quarterly chart of rate expectations. The March dot plot still showed one rate cut in 2026, but that is likely to disappear. The larger issue is whether the dot plot survives Warsh’s tenure in its current form.
The key planning shift is this:
- Less forward guidance means markets react more sharply to CPI and jobs reports.
- Fewer advance signals make retirement-income planning less predictable.
- Short-duration instruments — 1- to 2-year Treasuries, CDs, and money market funds — are better positioned because they reduce exposure to sudden long-end repricing.
This kind of communication transition is not new. When Ben Bernanke succeeded Alan Greenspan in 2006, markets watched not just the rate decision, but how he spoke. Warsh faces a similar moment, with the added challenge of a divided FOMC: four dissents at the April meeting, the most in decades.
A Fed that signals less is not automatically more dangerous for retirees. But it does change the environment. In that world, individual inflation and jobs reports carry more weight, and flexibility becomes more valuable than locking in long-duration exposure.
What the COLA Math Actually Means for Your Income in 2027
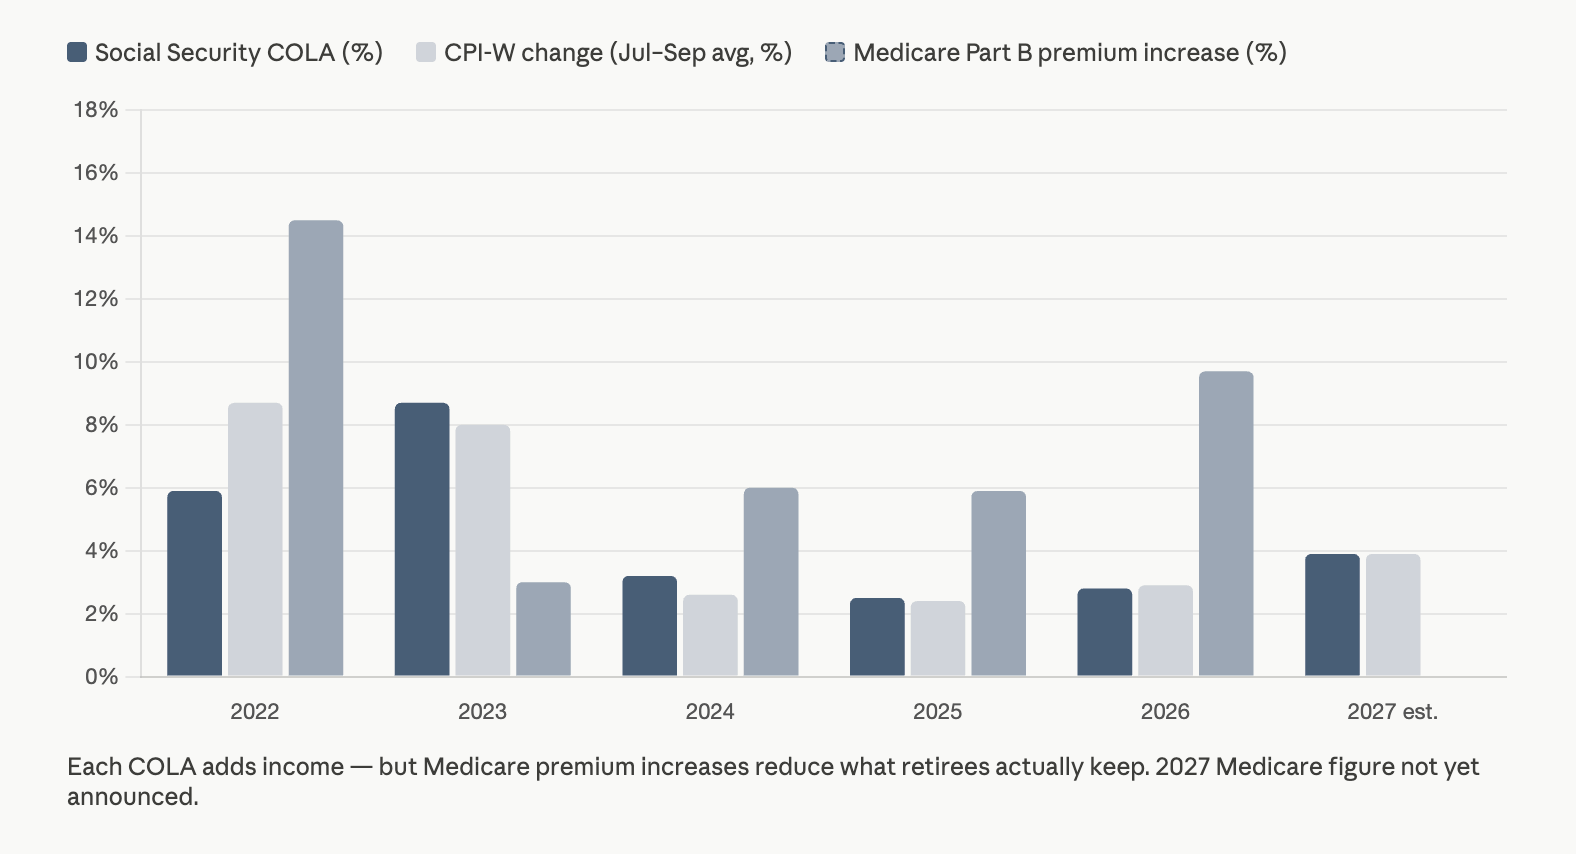
The good news is real: the 2027 Social Security COLA estimate has moved higher. The Senior Citizens League now projects 3.9%, up from 2.8% this year, while Mary Johnson estimates 4.2%. On the average retirement check of about $2,081 per month, a 3.9% COLA would add roughly $81 per month, compared with $56 from this year’s adjustment.
But the context matters. COLA is based on the CPI-W, an index built around urban wage earners, not retirees. That means healthcare, housing, and prescription drug costs can be underweighted relative to actual retiree spending. The result is a structural gap: benefits have lost about 14% of purchasing power since 2016 when measured against real retiree costs.
The key numbers to keep in view:
- 3.9% COLA would add about $81 per month to the average check.
- 2.8% COLA this year added about $56 per month.
- Medicare Part B reduced that gain by about $17.90, leaving closer to $38 net.
- 2027 premiums have not yet been announced.
The timing matters, too. The official COLA is determined by the average CPI-W readings for July, August, and September. That window opens in less than six weeks, and Wednesday’s May CPI is the last major data point before it begins. If energy costs stay elevated, the 3.9% estimate may hold or move higher. The official number will be announced in October.
❓ Today’s Question
"If Warsh scraps the dot plot — the Fed's quarterly rate forecast — how will I know where interest rates are headed, and how does that change how I should think about my CD and bond ladder?"
Short answer: The honest answer is that without a dot plot, rate direction becomes somewhat harder to anticipate in advance — and that is precisely the point Warsh intends to make. The dot plot has been useful, but it has also sometimes misfired badly, locking the market into expectations that data then forced the Fed to reverse. Without it, each CPI release and each FOMC statement carries more weight, because they become the primary signals rather than supplements to a published forecast. For your CD ladder and bond allocation, this means the planning horizon probably shortens somewhat.
Short-duration instruments — CDs maturing in one to two years, individual Treasury notes, money market funds — adjust faster to actual rate moves than longer-duration funds, and they do so without requiring you to predict what the Fed will do next. The practical step this week: look up the duration of any bond fund you own and compare its current yield against a 1-year Treasury at 3.79%. If the fund's yield is lower and its duration is high, that comparison tells you something concrete about the tradeoff you are carrying.

I remember watching Bernanke's first press conference after succeeding Greenspan in 2006, and noticing how much the room was listening for tone rather than content. The rate decision was secondary. What mattered was how this new person intended to lead — what words he chose, what he emphasized, what he left unsaid. That dynamic returns on June 17, and it is worth approaching with patience rather than anticipation.
The landscape this week is genuinely complex: an oil price that jumped this morning, a CPI arriving Wednesday, a new Fed chair nine days away from his debut. But complexity is not the same as danger. It is simply a landscape to understand clearly. That is the point of this newsletter, and it is the point of reading anything carefully before acting on it.
Stay steady. Wednesday will tell us something. June 17 will tell us more. 🔔
Regards,
David Ellison